

Most people expect compound growth to reward them quickly. They invest regularly, check their balances, and wonder why years of saving have produced so little investment growth. The frustration can make even a sensible long-term plan feel disappointing.
But compound growth works differently from ordinary saving. Someone investing $500 monthly could see roughly $85,500 after 10 years, yet nearly $585,000 after 30 years under a hypothetical 7% annual return.
The difference comes from years of earning returns on earlier returns, not just depositing more money. Understanding where that acceleration begins can change how investors measure their progress.
Why Compound Growth Feels Slow Before It Accelerates

Imagine a pond where a patch of lily pads doubles in size every day. If the pond becomes completely covered on day 30, it was only half covered on day 29. Just two days earlier, only one-eighth of the pond was covered.
That is the challenge of understanding exponential growth. The early stages can appear insignificant, even though each stage is necessary for the much larger increases that follow.
Compound growth operates on a similar principle, although investment returns do not follow the steady doubling pattern of lily pads. Investment balances can rise or fall, and the rate of growth changes from year to year.
A $20,000 portfolio earning 7% would gain $1,400 over one year without additional contributions. That is useful money, but it may not feel impressive after years of disciplined saving.
A $300,000 portfolio earning that same 7% would gain $21,000. The percentage is identical, yet the dollar increase is fifteen times larger because the starting balance is fifteen times greater.
This explains why the size of the investment base matters so much. Early contributions help build that base, while later returns have a larger amount of money to work on.
The Real Meaning of a Compound Growth Tipping Point

The tipping point of compound growth is often described as the moment an investment portfolio begins earning more money than its owner contributes.
That definition is useful because it measures something specific. It compares the dollars added through investment returns with the dollars added from personal savings.
Consider someone contributing $6,000 annually. If their portfolio earns 7%, its existing balance would need to be approximately $85,714 for a full year’s 7% gain to equal that contribution, before considering returns on new deposits.
Here is how different balances compare.
| Portfolio Balance | Growth at 7% | Compared With $6,000 Saved |
|---|---|---|
| $20,000 | $1,400 | Below |
| $50,000 | $3,500 | Below |
| $100,000 | $7,000 | Above |
| $200,000 | $14,000 | Above |
| $300,000 | $21,000 | Above |
These figures represent hypothetical one-year gains on starting balances, excluding additional deposits, fees, and taxes.
For someone saving $6,000 annually, a $100,000 portfolio could already produce more growth than contributions in a 7% year. For someone investing $20,000 annually, the crossover would occur at a considerably higher balance under the same assumption.
There is no universal dollar amount where compounding suddenly becomes powerful. The crossover depends on the investment return and the amount of money being contributed.
More importantly, reaching that threshold does not mean future investment gains will consistently exceed contributions. A down market can reverse the relationship immediately.
Compound Growth Shown Year by Year: What $500 Monthly Could Become
A hypothetical example makes the long-term pattern easier to understand. Suppose someone starts with no investment balance and contributes $500 at the end of every month for 30 years.
Assume an effective annual return of 7%, with the equivalent monthly growth rate applied consistently. The calculation excludes taxes, fees, withdrawals, and inflation, and represents a smooth mathematical projection rather than actual stock market performance.
The Complete 30-Year Breakdown
| Year | Total Deposited | Portfolio Balance | Cumulative Growth |
|---|---|---|---|
| 1 | $6,000 | $6,190 | $190 |
| 2 | $12,000 | $12,814 | $814 |
| 3 | $18,000 | $19,901 | $1,901 |
| 4 | $24,000 | $27,484 | $3,484 |
| 5 | $30,000 | $35,598 | $5,598 |
| 6 | $36,000 | $44,280 | $8,280 |
| 7 | $42,000 | $53,570 | $11,570 |
| 8 | $48,000 | $63,510 | $15,510 |
| 9 | $54,000 | $74,146 | $20,146 |
| 10 | $60,000 | $85,526 | $25,526 |
| 11 | $66,000 | $97,703 | $31,703 |
| 12 | $72,000 | $110,732 | $38,732 |
| 13 | $78,000 | $124,674 | $46,674 |
| 14 | $84,000 | $139,591 | $55,591 |
| 15 | $90,000 | $155,552 | $65,552 |
| 16 | $96,000 | $172,631 | $76,631 |
| 17 | $102,000 | $190,906 | $88,906 |
| 18 | $108,000 | $210,459 | $102,459 |
| 19 | $114,000 | $231,381 | $117,381 |
| 20 | $120,000 | $253,768 | $133,768 |
| 21 | $126,000 | $277,722 | $151,722 |
| 22 | $132,000 | $303,353 | $171,353 |
| 23 | $138,000 | $330,778 | $192,778 |
| 24 | $144,000 | $360,122 | $216,122 |
| 25 | $150,000 | $391,521 | $241,521 |
| 26 | $156,000 | $425,118 | $269,118 |
| 27 | $162,000 | $461,066 | $299,066 |
| 28 | $168,000 | $499,531 | $331,531 |
| 29 | $174,000 | $540,688 | $366,688 |
| 30 | $180,000 | $584,726 | $404,726 |
All values are rounded to the nearest dollar. Cumulative growth is the portfolio balance minus total contributions.
The most revealing change appears around year 11. During that year, the portfolio produces approximately $6,177 in investment growth, slightly more than the $6,000 contributed.
That is the first modeled year in which investment earnings exceed new contributions. It is a mathematical milestone, not a signal that the portfolio has become safer or that similar earnings will continue.
By year 20, cumulative investment growth has reached approximately $133,768. By year 30, that figure has grown to $404,726, despite the investor adding the same $500 each month throughout the entire period.
The final balance is approximately $584,726, but only $180,000 came directly from contributions. Almost 69% of the ending portfolio represents modeled investment growth.
What Changes After the First $100,000?

The first $100,000 is an important psychological milestone because investment growth begins to appear more substantial in dollar terms. However, nothing special happens inside a portfolio when its balance crosses that amount.
Under a 7% return assumption, $100,000 could produce $7,000 in annual growth. Increase that balance to $200,000, and the same return represents $14,000.
At $300,000, it becomes $21,000. The underlying percentage remains unchanged, but the investor now sees results that can rival several months of take-home pay.
That is why early saving can feel so different from later investing. Someone building their first $100,000 often depends heavily on wages and regular contributions, while someone with a much larger balance may see investment results play a greater role.
Current retirement savings data provides some perspective. Vanguard’s 2026 How America Saves research reported a median account balance of $44,115 and an average of $167,970 among participants in its defined contribution plans at the end of 2025.
The difference shows why averages can be misleading. Larger accounts pull the average upward, while the median describes the midpoint of the participants measured.
These figures do not represent the total retirement wealth of every American household. They also do not prove that savers with smaller accounts have abandoned investing, since account age, job changes, rollovers, and other savings all affect balances.
Still, the numbers demonstrate why reaching a six-figure portfolio is a meaningful accomplishment. It creates a larger base on which future returns can accumulate, even though it offers no guarantee of positive returns.
When Investment Growth Overtakes Your Contributions
The crossover point is easier to understand with a simple formula. Divide annual contributions by the assumed annual return, expressed as a decimal.
For example, someone contributing $20,000 annually and assuming a 7% return would calculate $20,000 divided by 0.07. The result is approximately $285,714.
At that balance, a 7% return on the starting portfolio would equal $20,000. This simplified calculation excludes growth on contributions made during the year.
How the Crossover Changes With Your Savings Rate
| Annual Contributions | Crossover at 7% | Crossover at 10% |
|---|---|---|
| $3,000 | $42,857 | $30,000 |
| $6,000 | $85,714 | $60,000 |
| $12,000 | $171,429 | $120,000 |
| $20,000 | $285,714 | $200,000 |
| $30,000 | $428,571 | $300,000 |
These are mathematical comparisons using assumed positive annual returns, not guaranteed investment thresholds.
The table explains why different people describe different tipping points. Someone investing $3,000 annually may experience a crossover at a relatively modest balance, while someone aggressively saving $30,000 each year may need a much larger portfolio.
The higher saver is not doing worse. They are simply setting a higher bar because their personal contributions are larger.
There is another distinction worth remembering. Investment growth exceeding contributions does not mean someone is financially independent.
A portfolio earning $20,000 in a positive year cannot automatically provide $20,000 of reliable annual retirement income. Market losses, taxes, inflation, withdrawals, and future spending needs all influence how much can safely be used.
How the Rule of 72 Explains Future Doublings

The Rule of 72 provides a convenient way to estimate how long an investment might take to double. Divide 72 by the assumed annual percentage return to get an approximate number of years.
At 7%, the calculation is 72 divided by 7, or about 10.3 years. At 10%, it is about 7.2 years.
The exact doubling periods under steady annual compounding are approximately 10.24 years at 7% and 7.27 years at 10%. Those estimates assume no additional deposits or withdrawals.
Consider someone with $80,000 invested and no further contributions. At a steady 10% return, four successive doublings would produce approximately $160,000, $320,000, $640,000, and eventually $1.28 million.
Each doubling adds more dollars than the previous one. The final increase of $640,000 is larger than the combined $560,000 added through the first three doublings.
That illustrates the arithmetic behind compounding. However, the complete four-doubling process would take approximately 29 years at 10% and roughly 41 years at 7%.
That difference matters for retirement planning. The historical U.S. stock market has delivered substantial long-term returns, but an assumed 10% should not be treated as an annual promise.
Why the First Decade Can Feel So Difficult
The most frustrating part of compounding is often the period when personal savings account for most of the portfolio. Investors contribute month after month, but their investment earnings seem small compared with the work required to save.
Return to the $500 monthly example. After 10 years, the investor has contributed $60,000 and accumulated approximately $25,526 in growth.
That is meaningful progress, but the original savings still represent most of the account. Someone comparing the balance with a distant retirement target might feel disappointed.
Now compare the following 10 years. Between years 10 and 20, cumulative investment gains increase from about $25,526 to $133,768, an increase of more than $108,000.
During the final decade, cumulative gains rise by approximately another $271,000. The investor contributes only $60,000 during that period, yet the modeled growth from investments is substantially larger.
This is why the later years can be so influential. More dollars are now invested, and returns from previous years have had additional time to generate their own returns.
The behavioral challenge is equally important. People often prefer rewards they can see immediately, a tendency called present bias.
Saving offers an immediate cost because money becomes unavailable for current spending. The reward may not feel substantial until much later, making consistent investing harder to maintain.
But slow early growth is not evidence that an investment strategy has failed. It is one possible outcome of beginning with a small balance, particularly when contributions are the main source of progress.
How Starting Earlier Can Change the Outcome

Starting early can create a surprising advantage, even when someone contributes for fewer years. The benefit comes from allowing each early contribution to remain invested for a longer period.
Consider two hypothetical investors, both measuring their balances at age 65. Both receive the same steady 7% annual return and invest $5,000 at the end of each contribution year.
The first investor contributes $5,000 annually for 10 years, beginning at age 25, then makes no additional deposits. Their total contributions are $50,000, and they leave the balance invested for another 30 years.
The second investor begins at age 35 and contributes $5,000 every year for 30 years. Their total contributions reach $150,000.
Under these assumptions, the early investor finishes with approximately $525,872. The later investor finishes with about $472,304.
The first investor contributes $100,000 less yet ends with roughly $53,500 more. The additional time allows those early deposits to compound for decades.
This does not mean starting early always beats saving more later. At lower returns, the outcome can reverse, and people who begin later can still make substantial progress through larger contributions.
For readers in their 50s or 60s, the lesson is not to regret earlier decisions. It is to recognize that increasing contributions, managing costs, and choosing investments suited to the remaining time horizon can still make a meaningful difference.
Why Market Crashes Can Interrupt the Growth Curve
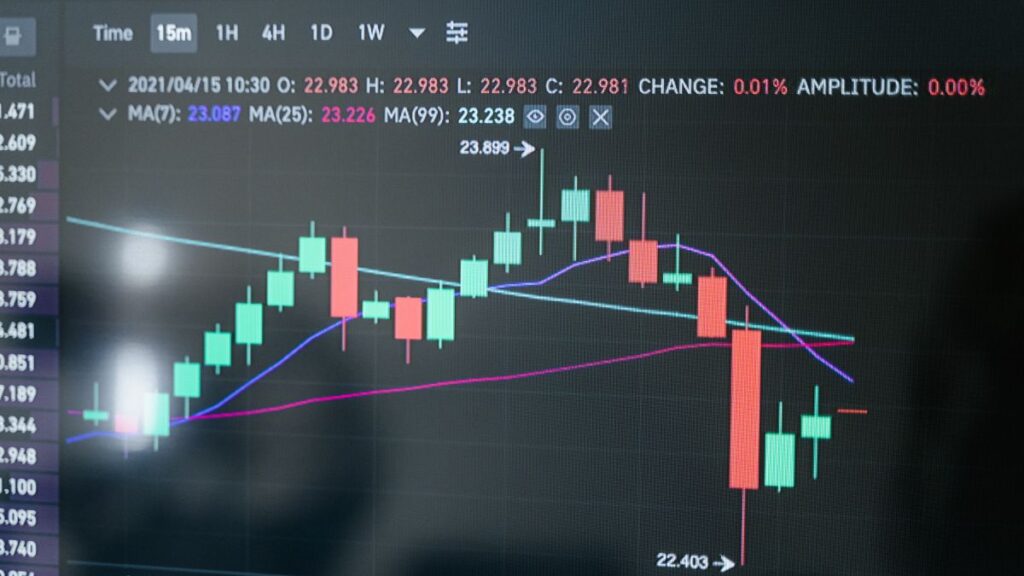
Smooth compound growth projections are helpful for explaining mathematics, but actual investment returns are unpredictable. A portfolio does not reliably earn 7% or 10% every calendar year.
Historical S&P 500 data compiled by NYU Stern shows how widely annual returns can vary. During 2008, the index lost approximately 36.6%, including dividends.
The 2000–2009 period also produced a slightly negative annualized total return for the S&P 500. Investors holding through that decade experienced a very different result from the steady upward curve shown in typical savings calculators.
This matters because a large portfolio can experience large dollar losses. Someone holding $300,000 who experiences a 30% decline loses $90,000 in market value, even without making a withdrawal.
Recovering that loss requires more than a 30% gain. A portfolio that falls by 30% must subsequently rise about 42.9% from its reduced value to return to its earlier balance.
Long-term investors with dependable income and enough time may be able to continue investing through downturns. Investors approaching retirement have an additional challenge because they may soon need to withdraw money for living expenses.
This creates sequence-of-returns risk, meaning the timing of investment gains and losses affects how long retirement savings may last. Large losses early in retirement can be especially damaging when withdrawals continue during a downturn.
The sensible response is not to assume every crash will reverse quickly. It is to maintain an investment mix that fits the need for growth, the time available, and the ability to absorb losses.
How Much Difference Do 4%, 7%, and 10% Really Make?
Investment projections become more useful when several return assumptions are compared. A single optimistic projection can create unrealistic expectations about how much money someone will have available.
The following comparison uses the same $500 monthly contribution, starting from zero. All three scenarios assume consistent effective annual returns, reinvested earnings, and no taxes or fees.
| Investment Period | 4% Return | 7% Return | 10% Return |
|---|---|---|---|
| 10 years | $73,348 | $85,526 | $99,932 |
| 20 years | $181,921 | $253,768 | $359,130 |
| 30 years | $342,635 | $584,726 | $1,031,422 |
These are hypothetical nominal-dollar projections, not forecasts or guaranteed outcomes.
After 10 years, the difference between 4% and 10% is approximately $26,600. After 30 years, that gap grows to nearly $689,000.
That is an enormous difference for someone planning retirement. It shows how sensitive long-term balances can be to the investment returns actually achieved.
The 10% scenario is not necessarily the appropriate planning assumption for every investor. A diversified portfolio containing substantial bonds or cash may have lower long-term growth potential than an all-stock portfolio, while typically offering a different level of risk.
Even an all-stock investor cannot count on the historical average being repeated over their particular investment period. Planning with multiple outcomes helps reveal how much uncertainty a retirement goal contains.
Inflation and Investment Fees Can Quietly Shift the Finish Line

A growing investment balance does not tell the entire financial story. What matters in retirement is how much that balance can purchase after years of changing prices.
Suppose inflation averages 3% annually over the same 30-year period. The hypothetical $584,726 portfolio would have purchasing power equivalent to approximately $241,000 in today’s dollars.
That does not erase the value of compounding, but it changes how the ending balance should be interpreted. A dollar amount that looks substantial today may support considerably less spending several decades later.
The Bureau of Labor Statistics uses the Consumer Price Index to measure changes in consumer prices and compare purchasing power across different periods. Investors can apply a similar adjustment when evaluating future retirement savings.
Investment fees create a second obstacle. The SEC warns that ongoing fees reduce both the amount remaining invested and the future returns those deducted dollars could have earned.
Consider the same 30-year monthly savings model with a 7% net return compared with a 6% net return. At 7%, the balance reaches approximately $584,726, while at 6%, it reaches approximately $487,256.
That one-percentage-point difference produces nearly $97,500 less wealth under the stated assumptions. The lower net return could result from costs or weaker investment performance, so it should not automatically be treated as the exact effect of a particular fee.
The practical point is that costs deserve attention alongside market returns. Investors control neither the market nor future inflation, but they can compare expenses and avoid paying for services that do not provide sufficient value.
How to Protect Compound Growth Over the Long Term
The most useful compounding strategy is not about finding a particular balance where investing suddenly becomes easy. It involves creating conditions that allow savings and investment returns to work together over many years.
Regular contributions establish the foundation. Sensible investment choices, appropriate risk management, and attention to fees help protect the value of the money accumulated.
A Practical Compound Growth Action Plan
| Priority | What to Review | Practical Next Step |
|---|---|---|
| 1 | Cash reserves and expensive debt | Protect emergency savings and evaluate high-interest balances |
| 2 | Monthly investment contributions | Automate an affordable amount and increase it when possible |
| 3 | Employer retirement benefits | Review available matching contributions and plan conditions |
| 4 | Diversification and investment fees | Check asset allocation and total investment expenses |
| 5 | Retirement time horizon | Adjust investment risk as withdrawals approach |
The order matters because investing is only one part of financial stability. Someone without emergency savings may be forced to sell investments during a market decline, potentially interrupting their long-term plan.
Likewise, carrying expensive credit-card debt while investing aggressively may create a difficult financial tradeoff. The interest owed on that debt can be much more predictable than the returns expected from investments.